Week 2: Experimenting with CSS, HTML and Building a Personal Website
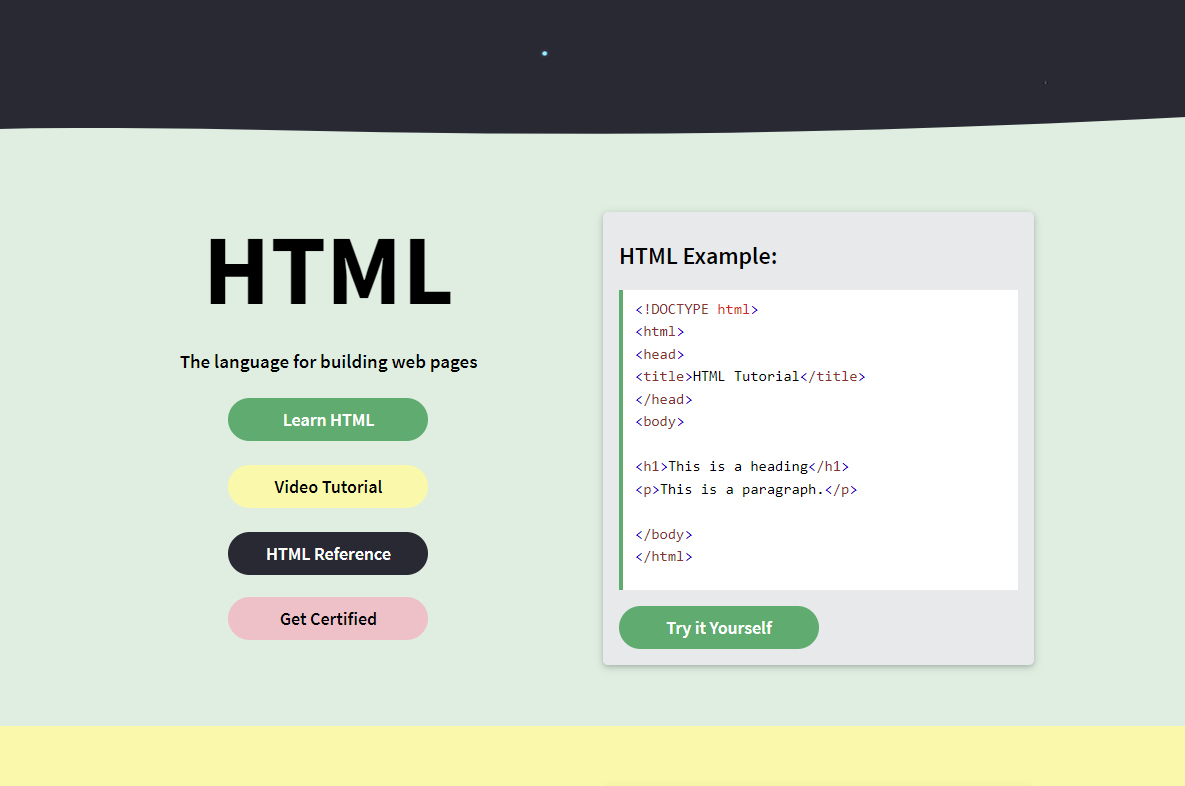
As the first Workshop, we learnt the basics of web development before the class. Honestly, although I had learnt the basics of html and CSS in my freshman year, it was three years ago. I was a bit nervous to open the link to the course and face the amount of information. Fortunately, by watching the teaching videos, the knowledge scattered in the corners of my memory was finally reawakened, which made me feel a little bit more confident about the Workshop.
The most surprising part of the Workshop was that we were authorised to use the domain name assigned by the school to launch our own personal websites in the following year. You know, renting a server is not cheap! However, the joy was soon washed away when Dr Holly introduced us to two platforms for uploading our own websites, cPanel and FileZilla, and recommended us to use FileZilla for the uploading process. However, the firewall of my computer always blocked it, and even after I closed the firewall, it still could not be fully installed, which was really frustrating for me. Fortunately, cPanel worked perfectly fine, so I was able to upload my pages.
Week 3: Web Scraping and the Digital Monopoly
To be honest, I hadn't studied any of the previews that Dr Holly had posted on Minerva before Friday, and I had thought that this week's Workshop would probably just be a continuation of last week's content, perfecting my personal homepage. Until a message from my friend knocked me out of my beauty sleep, ‘Damn, Siri, don't you think it's funny? We just learnt the basic framework of webpage creation last week, and this week it's going to be us writing crawler code to crawl webpages!’ She said, crying and laughing. It was about 11.40pm on a Thursday night at this point, and this news made me bounce straight out of bed and quickly switch on Minerva to prep.
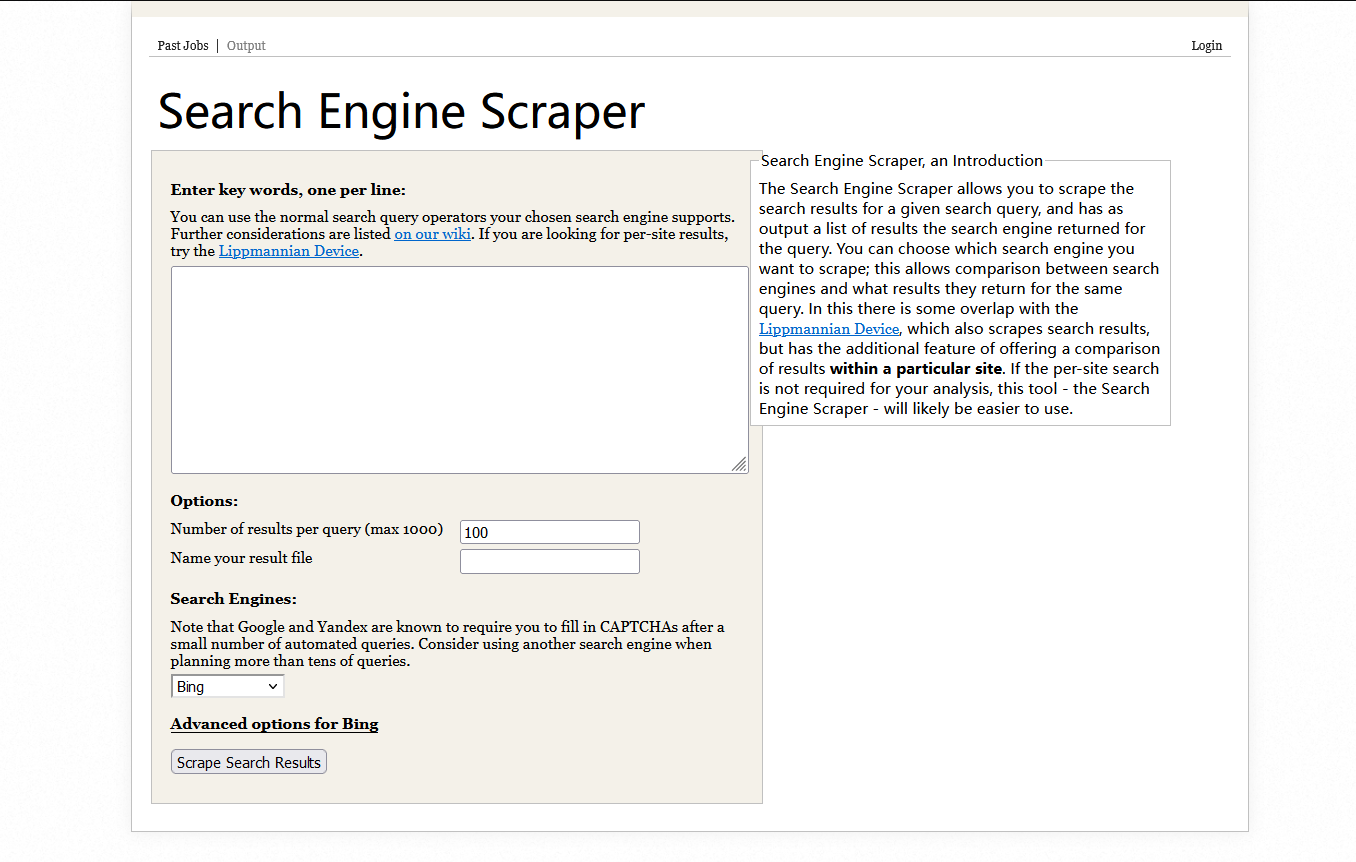
During the Workshop, Dr Chris introduced us to a variety of Web Scraping tools and methods, which I did my best to try and follow but still left me feeling on pins and needles as I had no Python foundation whatsoever. Although, there are some software or plug-ins that can be used directly, the result is still quite unsatisfactory. Especially when using ‘Web Scraper’, even Dr Chris could not solve the problem.
Between classes, I discussed with Chris and Holly the potential causes of this problem. One of the possibilities was that the data source had closed the API. I told Drs. Chris and Holly about how more and more Chinese Internet companies are choosing to compress web functions and services on the PC side and closing APIs, and moving more functions to the PE side, which makes data scraping more and more difficult, and Chris said that it's not just Chinese Internet companies that are doing this. Chris said that it's not just Chinese internet companies that are doing this. Including, Facebook, Amazon, Redditt, etc. are becoming more and more conservative about data scraping from third parties, and a lot of the data that used to be easily accessible is now becoming very difficult to access.
I've been thinking about this issue a lot on my way home from class. On the one hand, I understand that restricting or even shutting down data capture channels is necessary for user data security. But on the other hand, what I saw was the ‘coercion’ of Internet companies on users, who had to download their apps, and academic researchers who wanted more data could only choose to pay a lot of money to these Internet companies or third-party companies with technical channels. This digital monopoly led by the oligarchs of the mutual benefit network is becoming more and more common, and as an ordinary user I can't do anything about it.
I vaguely remember Berners Lee, the ‘Father of the Internet’, once said, ‘The most valuable thing about the Internet is that it gives people equal access to information.’ However, today's online world is becoming more and more closed, and the digital divide between us, the average user, and the oligarchs and technological elites is getting bigger and bigger. Have we lost touch with the original purpose of the Internet?
Week 4: Data and Data Analysis
For this week's workshop, Holly divided us into 4 groups, and it seemed to be the first time we had worked in groups this semester. We had a lot of fun naming our groups, and we chose to let ChatGPT give us a name that would be ‘middle-of-the-road’ enough for us, and we chose ‘Shadow Phoenix’ out of the names that were generated. As a Warhammer 40K enthusiast, I was quite happy with this group name as it sounded like a sub-group of the Sons of the Emperor.
The aim of the session was aimed at getting us to try and create a dataset, Holly gave us three pre-determined scenarios which were, student-led; university-led; and researcher. We chose the third one, the scenario required us to collect data about generative AI and hoped that this data would help us all to better understand the impact of AI on the SOCIAL WORLD. We chose to peer into the potential biases of generative AI by generating content about AI. On the one hand, similar experiments have been done by scholars before, and while we have a reference scenario, we are interested in seeing if the problems with AI demonstrated in past studies will still be present today. On the other hand, choosing this scenario is relatively less demanding on our data crawling skills; we do not need to write our own code to crawl data from various platforms, we just need to collect and categorise the generated content from the AI. The only thing that confused us was the selection of variables, Holly patiently gave us a lot of insights, she said, the generated images, such as clothing, environment, religious elements, etc. can be part of the variables. I must say that this was a great inspiration for us.
Week 5: Data Visualisation
In this week's workshop, Holly firstly showed us some examples of digital visualization, among which the visualization of the deaths of the American shooters was very shocking to me. The curves that symbolize the lifeline of each victim also symbolize the parabola of the bullets. predicted life expectancy if the victim had not been shot. This kind of data presentation combined with graphic narrative is an artistic and efficient way of presenting data, and perhaps I can try to create similar charts in my future studies and work.
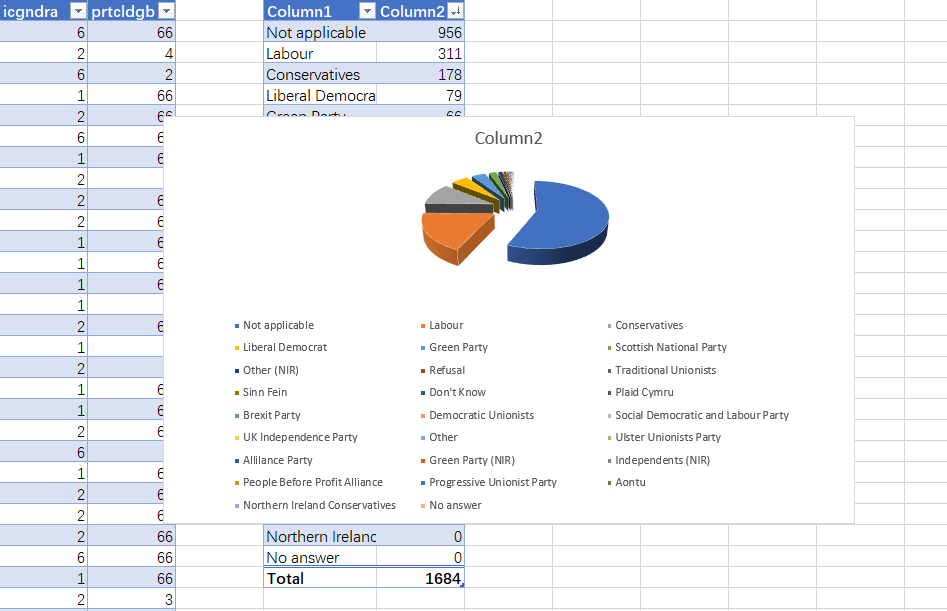
After that, we practiced data visualisation through Excel's charting function. Unfortunately, the data we collected in Week 4 was not available due to the sample size and complexity, and we chose to use the dataset prepared by Dr Holly. This also gives us a good reference for making our own dataset in the future, at least we now know where to optimise the dataset we created.
Week 7: Machine Learning
Although last week's hardware development workshop ‘disappeared’, I was equally excited about this week's content. To be honest, this is not my first time to encounter machine learning technology, last year when AI drawing became a hot topic, I tried to build my own drawing model through machine learning, although the result was not ideal, but still let me have a lot of fun.
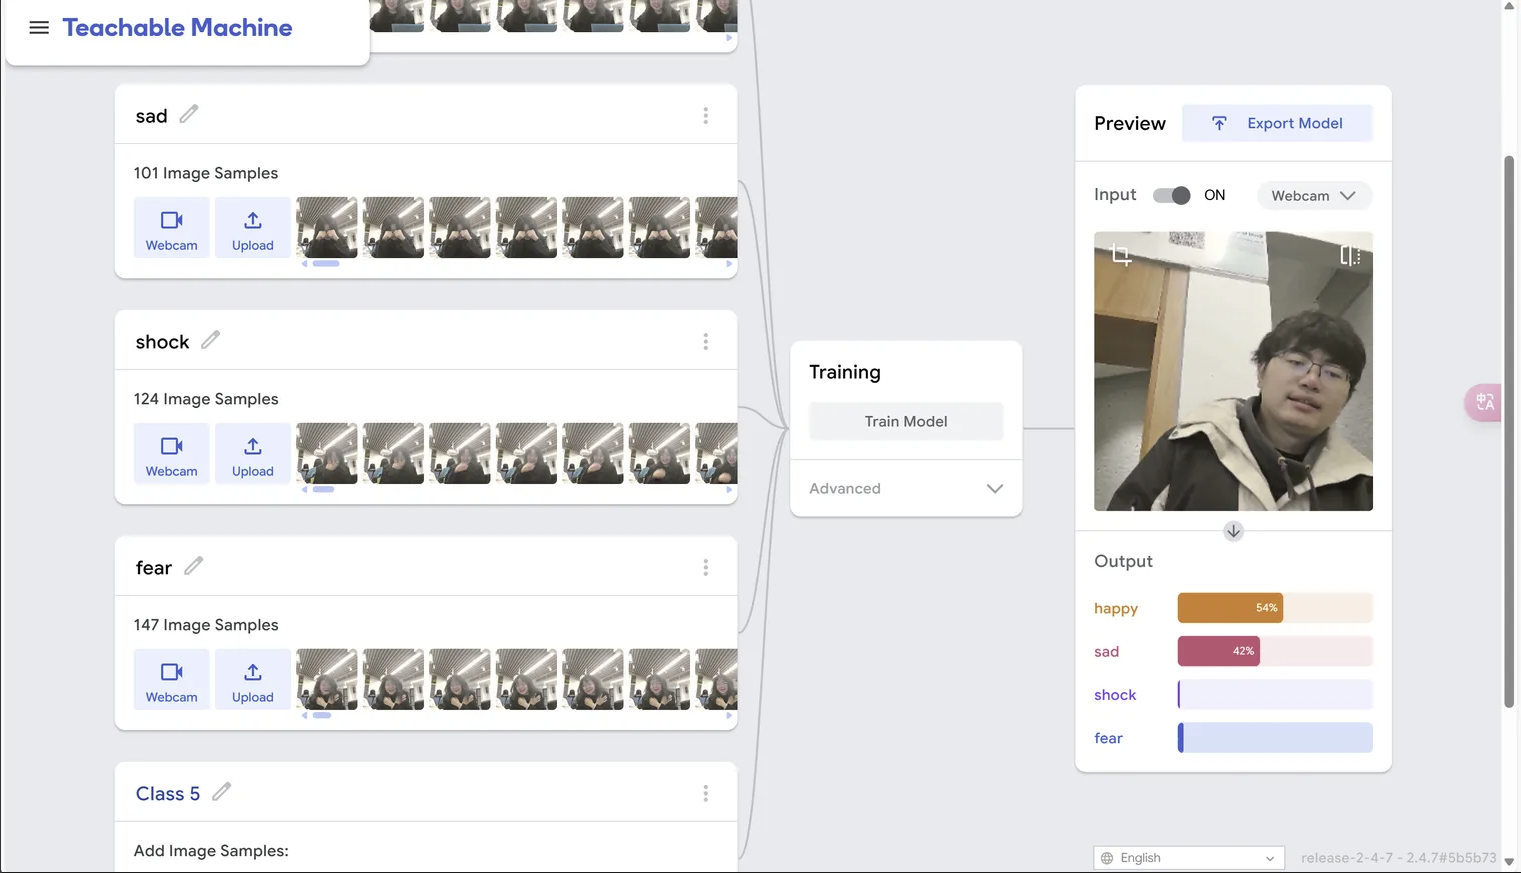
When working in a group, we first experienced Teachable Machine's image recognition training, we made three different facial expressions, took our portraits through the computer camera and uploaded them as the training dataset. What surprised me the most was the speed of training on this platform, in my past attempts this process often took me more than half an hour, however TM only took a few seconds. I was curious to see the author of this website's brief description of the technology used, which gave me my first insight into the concept of MobileNet as a built-in predefined model that simplifies the training process to a great extent, and that's why TM's training was so fast.
However, although we quickly obtained a model for recognition, its recognition accuracy was very poor. We initially suspected that it was due to too few samples, but after we added twice as many photos, the results were still rendered worse. We found that the algorithm seemed to be more susceptible to the background behind us than our faces. Another conclusion we came to after our exchange was that even though the dataset seemed to be large (100 photos) its sample diversity was actually very low because there were only five of us in total, and because it was taken consecutively, there was almost no difference between each photo of each person. In terms of diversity, we only have ‘5 photos’ in each dataset! And this seems to be the main reason for the poor results of our model.
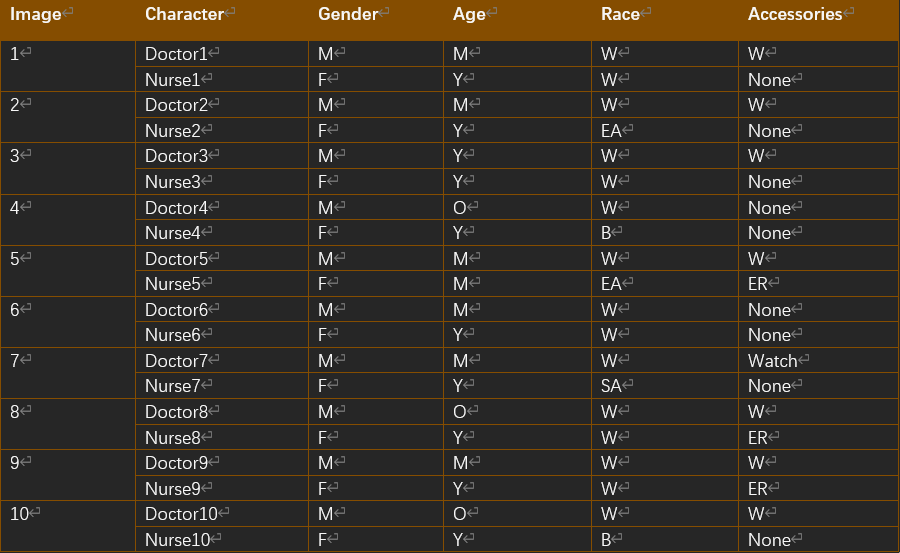
The experience in Workshop reminded me of the algorithmic bias mentioned in this week's lecture, where the same lack of sample diversity can lead to more serious problems of discrimination and inequality in more complex applications of machine learning in society. This also reminds me of what I captured after the Week 4 Workshop, where I asked ChatGPT to generate 10 images for me of ‘primary care doctors and nurses communicating’, yet all of the doctors were white males, and the nurses, although they appeared to be of different skin colours, were invariably of the female gender. The nurses are of different skin colours, but their gender is invariably female. This is the stereotypical gender distribution in healthcare, where male doctors do far outnumber women, and this bias is picked up by the machine learning algorithms along with the training data, resulting in the current results. This bias is so deep that ChatGPT has never been able to generate an image with a female doctor in it, despite a World Health Organisation survey stating that female doctors already make up nearly 20% of the medical profession today!